
How to read your restaurant reports: sales, covers and repeat guests
Find out what's working in a few minutes a week: revenue, bookings, no-shows, order times and repeat guests, compared with the last period. Export to CSV.
You don’t need to be good with spreadsheets to run on numbers. Ten minutes on a Monday morning with your reports tells you whether last week’s offer worked, whether no-shows are creeping up and how quickly the kitchen turned orders round.
Start with the overview
Open Reports from the sidebar. Overview shows one headline number from each report, the change against the previous period and a trend line. A sentence at the top sums up how many reports are up and which fell the most.
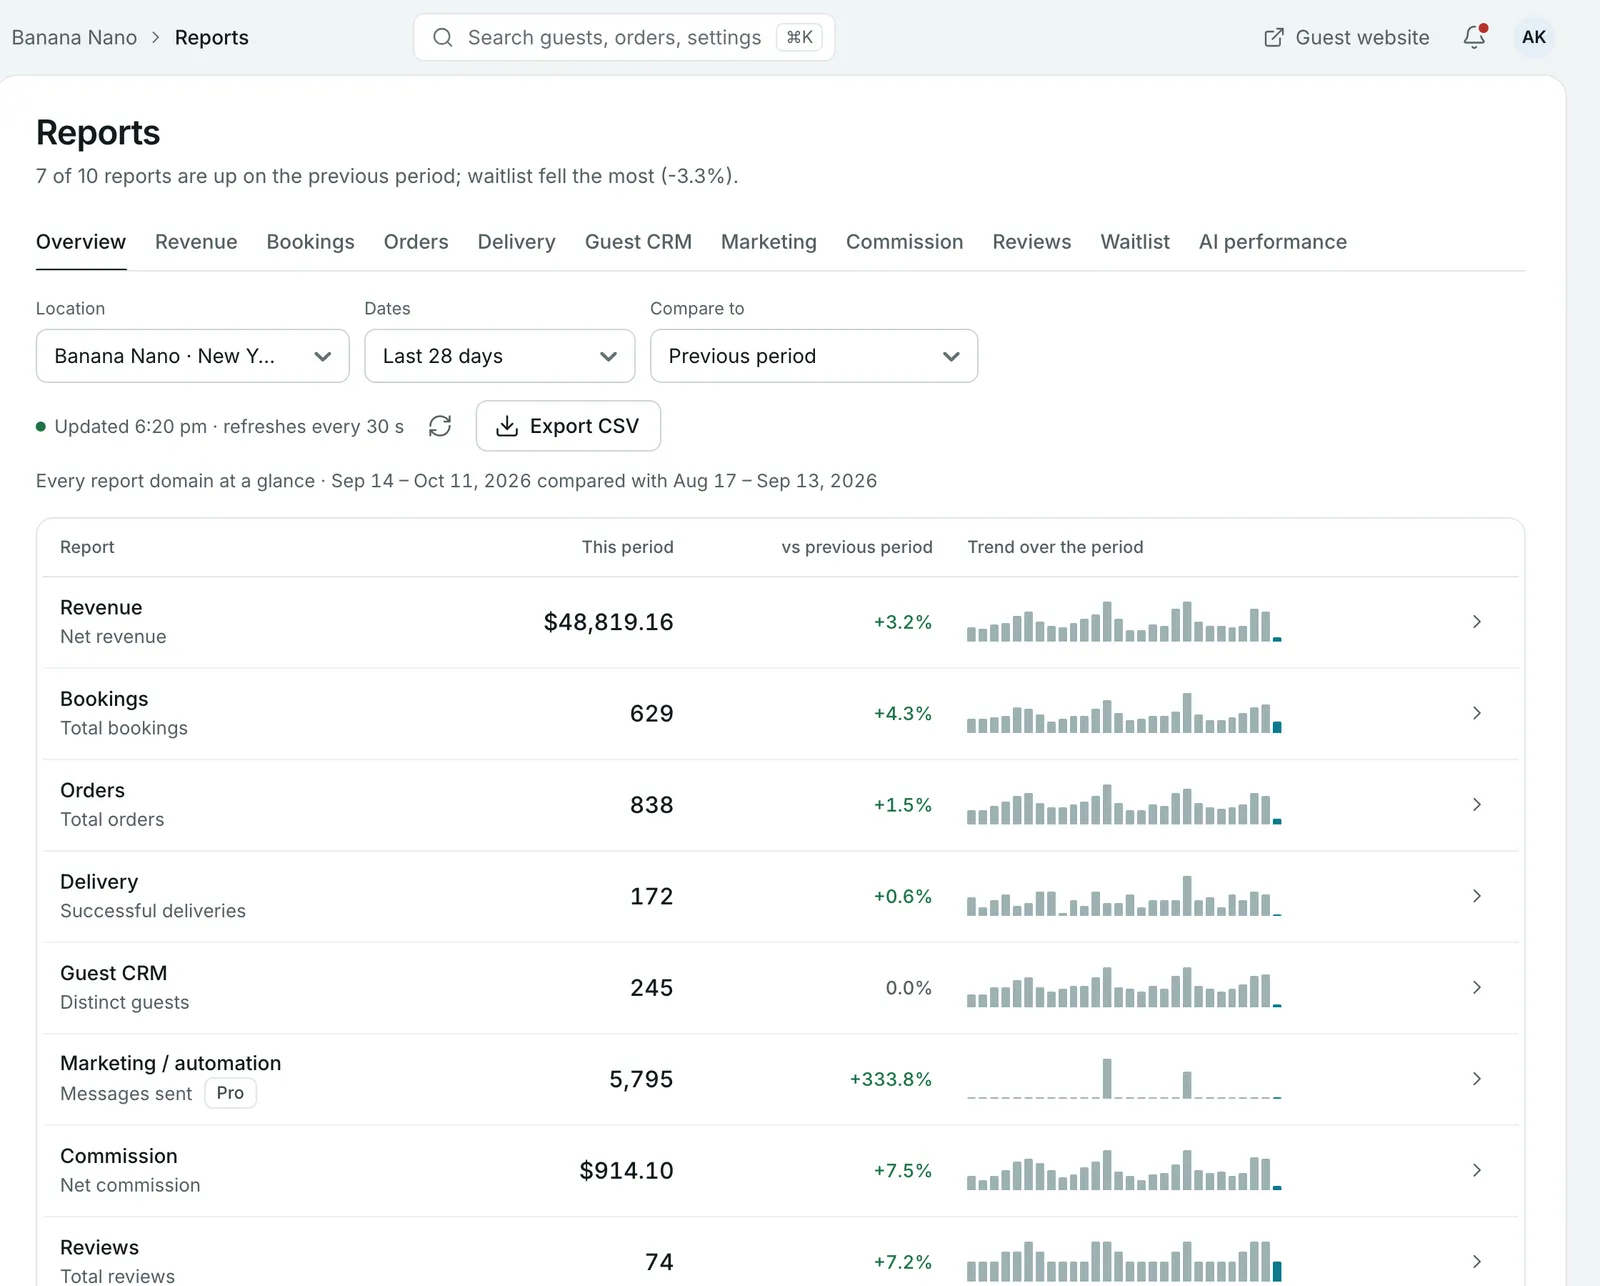
Select any row, or a tab along the top, to open that report.
Choose your dates and comparison
Three controls sit at the top of every report:
- Location: one restaurant or All locations.
- Date range: for example Last 7 days, Last 28 days, This month, Quarter to date or Custom dates.
- Compare to: Previous period, Previous period (match day of week), Previous year, Custom comparison or No comparison.
Use Previous period (match day of week) for weekly checks, so a Saturday is compared with a Saturday.
The reports
| Report | Headline number | Look here for |
|---|---|---|
| Revenue | Net revenue | Gross and net revenue, commission, refunds, and revenue from bookings and from orders, with every transaction listed |
| Bookings | Total bookings | Covers, arrivals, no-show rate, cancellations, average turn time and where bookings came from |
| Orders | Total orders | Average order value, cancellation and rejection rates, average prep time and orders by fulfilment type |
| Delivery | Successful deliveries | How your own deliveries went |
| Guest CRM | Distinct guests | New and returning guests, repeat visit rate, average revenue per guest and lifetime value |
| Marketing | Messages sent | What your campaigns and automations sent (Pro) |
| Commission | Net commission | Commission on your online channels |
| Reviews | Total reviews | Reviews over the period |
| Waitlist | Waitlist entries | How many guests joined your waitlist |
| AI performance | Conversations handled | Conversations your AI assistant handled (Pro) |
Charts mark your campaigns and menu launches on the timeline, so you can see whether a send lined up with a rise in bookings.
Five numbers worth checking every week
- Net revenue against the previous period: is the business growing?
- No-show rate in Bookings: if it’s rising, review your deposits. See How to take booking deposits and cut no-shows.
- Avg prep time in Orders: if it’s longer than the time you quote guests, adjust your prep time rules. See How to set up pickup and delivery.
- Rejection rate in Orders: rejected orders often mean dishes that should have been set to Sold.
- Repeat visit rate in Guest CRM: are first-time guests coming back? If not, set up a welcome journey. See How to send automatic birthday, welcome and win-back messages.
Export to a spreadsheet
Select Export CSV on any report to download it for your chosen dates and location, for example to send to your accountant.
Common questions
How do I compare this month with last year?
Set Date range to This month and Compare to to Previous year. Every report then shows the change against the same month last year.
What's the difference between gross and net revenue?
The Revenue report shows gross and net revenue side by side, with commission and refunds broken out, and lists every transaction with its gross, commission, net and refund.
How do I get the numbers into a spreadsheet?
Select Export CSV on any report. It exports what's on screen for your chosen dates and location.
How often do reports update?
They refresh every 30 seconds while the page is open, and show when they were last updated.
Why does a report say Pro?
The Marketing and AI performance reports are part of the Pro plan.
Still stuck? Submit a ticket
Tell us what you're trying to do. We'll attach this guide to your ticket, so you don't have to explain it twice.